The crucial role of data visualization in the digitization of the factory floor.
The significance of data visualization technologies in advancing Industrie 4.0 implementation.
How data visualization facilitates access to interconnected systems.
Across the industrial sector, data analytics and the visualization of results are expected to instigate change and streamline the digitalization of the factory floor. Unlike data analysts who comprehend figures on an analytical dashboard, the average factory-floor operator lacks the training to interpret analyzed data. Thus, there is a need for simplified processes to make data visualization accessible to everyone.
Digitalization of the Factory Floor and Data Visualization
To comprehend the importance of data visualization, consider the analogy of two accelerating cars – one with a speedometer and the other without. This analogy illustrates the difference between being able to visualize data in real-time and not having that capability. In a digitalized factory, having a ‘speedometer’ equivalent for data visualization is crucial. Operators with real-time information can align with the master production plan, while those without may experience downtime or significant changes to expected throughput.
Building an interconnected framework, capturing, and analyzing data are initial phases in the digitalization of the factory floor. The next crucial phase is providing end-users, operators, and decision-makers with actionable information. Data visualization involves dynamic stories or information that genuinely provides insight.
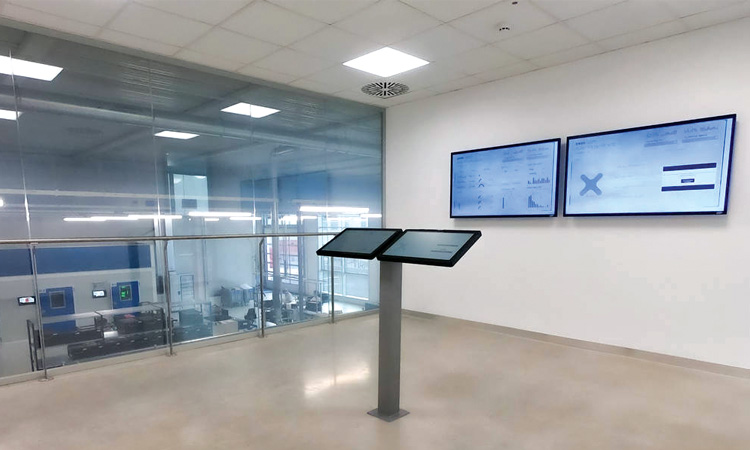
According to Gartner, dynamic data and data visualization technologies will replace traditional point-and-click dashboards in brownfield factories. These technologies include human-machine interfaces (HMI), dynamic web-based HMIs or panels, and smart mobile devices.
Data Visualization Technologies and Industrie 4.0 Business Models
Web-based HMIs are becoming the preferred technology for visualizing data in digitalized factories due to their ability to deliver contextual information through rich animations, graphs, and informal content. Smart mobile devices and wearables offer a viable ecosystem for visualizing industrial data remotely and on the go, supporting the remote access essential in Industrie 4.0.
While web-based HMIs excel in visualizing data from individual equipment and interconnected systems, the digital twin serves as a powerful tool for data analysis and visualization on a single digital platform. The digital twin, a digital mirror of physical processes, relies on data visualization hardware to showcase its results to decision-makers.
How Data Visualization Improves Performance
Visualizing data from individual equipment, connected systems, and entire production lines enhances performance in various ways. For example, it facilitates the optimization of data-driven plant performance plans by comparing individual equipment data to optimal benchmark data. Animations highlighting performance discrepancies help operators fine-tune equipment or production processes.
General display panels can also showcase the performance of individual machines within a production unit, allowing operators and managers to quickly identify areas or operators struggling with equipment. Experienced personnel can then intervene to ensure optimal performance.
Conclusion
The future of industrial pursuits lies in the digitalization of the factory floor, where data visualization plays a significant role in implementing successful digital transformation initiatives. Factory owners aiming for continuous digital transformation must actively seek the best data visualization solutions to ensure successful implementation.
[Courtesy: Exor]
![]()
For more information,
www.exorint.com